The Texas Sharpshooter
How we fire first, draw the target afterwards, and then admire how well we aimed.
The Texas Sharpshooter
An assassination hidden in Moby-Dick
In 1997, the journalist Michael Drosnin published The Bible Code, and it became an international bestseller. Its claim was startling. If you took the Hebrew text of the Torah, removed the spaces, and read every seventh letter, or every fiftieth, you could find hidden words. And when you arranged the letters in a grid, those hidden words seemed to cluster together in meaningful ways. Drosnin wrote that he had found the name of the Israeli prime minister Yitzhak Rabin crossed by a phrase about an assassin, and that he had tried to warn Rabin more than a year before Rabin was shot in Tel Aviv in November 1995.
The book built on a real paper, published in 1994 in the journal Statistical Science by three Israeli researchers, Doron Witztum, Eliyahu Rips and Yoav Rosenberg, which claimed that the names of famous rabbis appeared close to their dates of birth and death in Genesis more often than chance would allow. Drosnin's version was far bolder. In an interview with Newsweek, he offered his critics a challenge, roughly this: find a message about the assassination of a prime minister hidden in Moby-Dick, and I'll believe you.

Brendan McKay, a mathematician at the Australian National University, took him at his word. Using the same skipping method on Herman Melville's novel, he found "predictions" of the assassinations of Indira Gandhi, Martin Luther King Jr and John F. Kennedy, among others, each with related words nearby. McKay's point was that a long enough text contains an enormous number of possible letter sequences, and if you are free to choose which words to look for, which spellings to allow and which nearby words count as related, you will always find something that looks astonishing. In 1999, McKay and three colleagues published a detailed reply to the original Genesis paper in the same journal, arguing that the flexibility in how the rabbis' names and dates were chosen was enough to explain its results.
This is the Texas sharpshooter fallacy. It's named after a joke about a Texan who fires a gun at the side of a barn, then walks up, finds the place where the bullet holes are bunched most tightly, and paints a target around them, before calling himself a crack shot. The fallacy is finding a pattern in data after the fact and treating it as meaningful, when you chose the pattern because it was there.
Drawing the target after the shots
Nobody seems sure who first told the joke, but the phrase became standard in epidemiology, where investigators kept meeting a neighbourhood with what looks like too many cases of an illness, and a strong urge to explain it. It has relatives with more formal names. The clustering illusion is the tendency to see meaningful clumps in random data. HARKing, a term coined by the psychologist Norbert Kerr in 1998, stands for hypothesising after the results are known: writing up a finding you stumbled across as if you had predicted it all along.
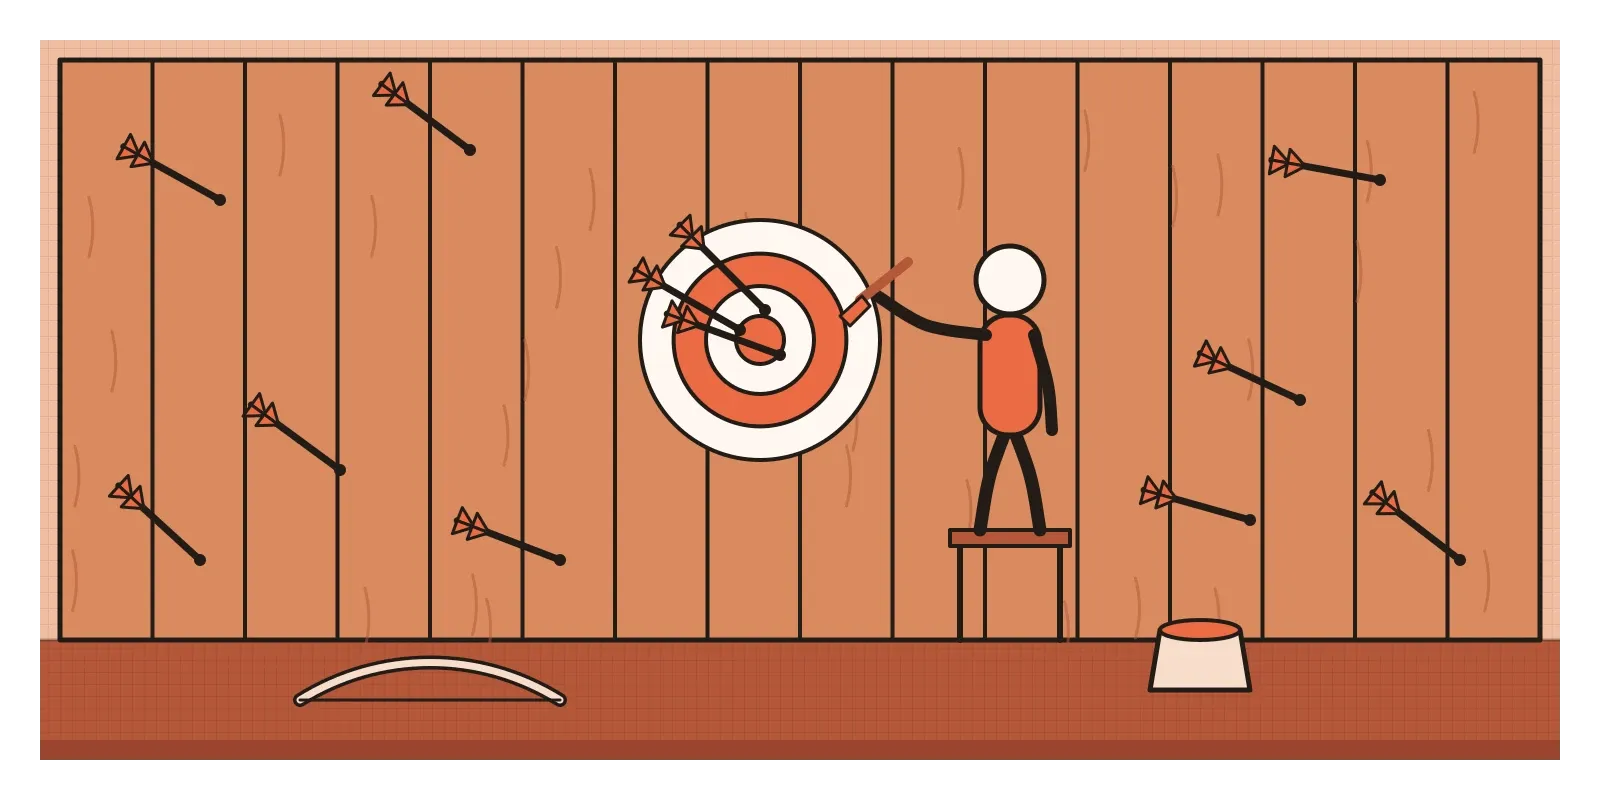
It's worth separating this from its neighbour in the post on cherry picking. Cherry picking starts with a conclusion and selects the evidence that supports it. The sharpshooter starts with the evidence and selects the conclusion that fits it. The first hides the holes outside the target. The second moves the target to wherever the holes happen to be.
In 2011, the psychologists Joseph Simmons, Leif Nelson and Uri Simonsohn showed how easily this can happen inside careful research. In a paper called "False-Positive Psychology", they ran a real experiment in which students listened either to the Beatles song "When I'm Sixty-Four" or to a control track. Then, using common choices about which measures to report, which variables to control for and when to stop collecting data, they produced a statistically significant result showing that listening to the Beatles song made people nearly a year and a half younger. None of those choices was unusual, which was the point. The statisticians Andrew Gelman and Eric Loken later called this the garden of forking paths: even honest researchers make many small choices after seeing the data, and each one lets the target drift towards the holes.
Why random looks so suspicious
Our minds are built to find patterns, and they are far better at finding them than at noticing when there's nothing there. In 1958 the German psychiatrist Klaus Conrad coined the word apophenia for the experience of seeing meaningful connections between unrelated things. In milder forms it's everywhere: faces in electrical sockets, a run of bad luck that feels like a message.
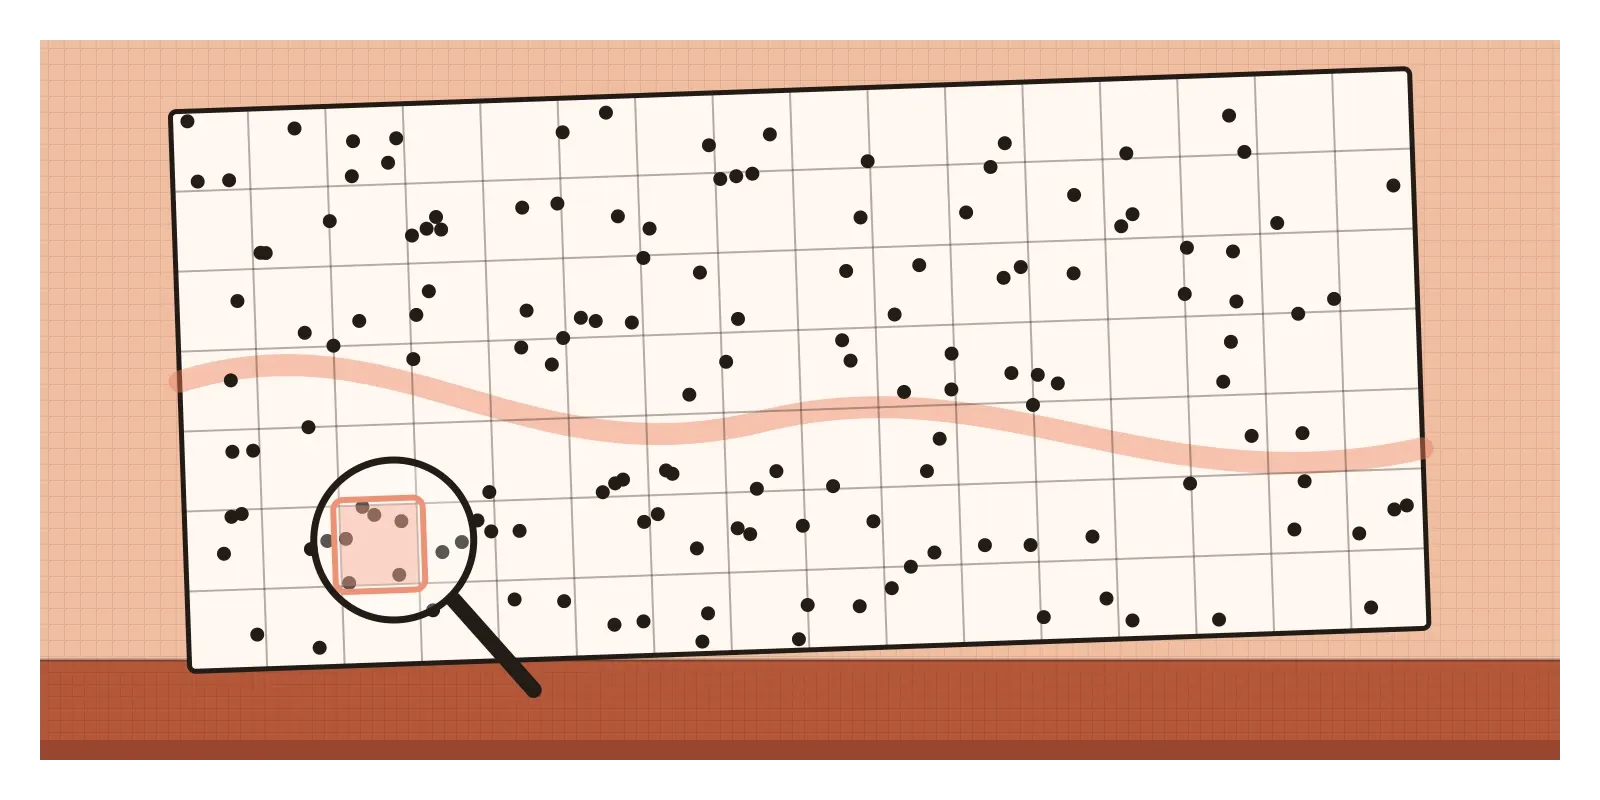
Part of the trouble is that we have the wrong picture of randomness. We expect it to look evenly spread, but truly random events clump. During the Second World War, many Londoners believed German flying bombs were landing in deliberate clusters, which suggested precise targeting. In 1946, an actuary named R. D. Clarke divided a large area of south London into several hundred small, equal squares and counted the hits in each. The pattern matched almost exactly what you would expect if the bombs had fallen at random. Some squares really were hit several times. It just didn't mean anything.
In 1985, Thomas Gilovich, Robert Vallone and Amos Tversky argued that basketball fans' belief in a "hot hand", players getting into streaks where they can't miss, was largely this same illusion. The story has a twist. In 2018, the economists Joshua Miller and Adam Sanjurjo found a subtle statistical bias in the way the original study had counted streaks, and when they corrected for it, a modest hot hand seemed to appear after all. Patterns in noise are a real trap, but so is deciding too quickly that a pattern must be noise.
We also enjoy the sharpshooter's stories. Cricket commentary is full of them. You'll hear that a team has never lost at a certain ground when batting first in a day match, or that a batter always scores runs in the second innings of a Test against a particular side. With hundreds of matches and thousands of ways to slice them, some slices will always look remarkable. They make good conversation over chai, and a poor basis for picking a team.
Cancer clusters and the map of fear
The most painful real cases are cancer clusters. A family notices that several neighbours on their street have been diagnosed with cancer in a few years. They start to look for a cause, a factory, a power line, a water supply, and once they look, there is almost always something nearby. Health departments investigate such reports seriously, because occasionally there really is a cause.
In 1999, the surgeon and writer Atul Gawande wrote an essay for The New Yorker called "The Cancer-Cluster Myth". He described how rarely these investigations found anything. He quoted a calculation by Raymond Richard Neutra, a senior environmental health official in California, which went roughly like this: with around eighty types of cancer and several thousand census tracts in the state, you would expect thousands of tracts to show a statistically significant excess of at least one cancer purely by chance. Every one of those excesses is a bullet hole that someone, somewhere, is likely to notice and paint a target around. A later review of more than four hundred cluster investigations carried out in the United States between 1990 and 2011 found that only a minority confirmed any real excess of cancer at all, and almost none linked it convincingly to a cause.
None of this makes the people who report clusters foolish. They are living inside the pattern. But the boundaries of the cluster, the street, the years, the types of cancer that count, are drawn after the cases are seen, which is exactly what makes the cluster look so striking.
A dashboard with a thousand slices
Picture a team that has just launched an AI writing assistant inside a note-taking app. Overall, the feature's effect on thirty-day retention is flat. Disappointed, an analyst opens the dashboard and starts slicing. By city. By device. By day of the week. By time of day. By plan. After an afternoon, she finds it: users in Pune, on Android, who first tried the assistant on a weekday morning, kept using the app at a rate thirty-four per cent higher than everyone else.

By the next review, the finding has become a story. Pune has lots of young professionals with long commutes, and weekday mornings are when people plan their day. The slide is titled "Morning commuters love the assistant", and someone suggests a marketing campaign for commuters in Pune.
Now count the slices. Twenty cities, three device types, seven days, four times of day, two plans: that's more than three thousand combinations. If you test that many groups at the usual threshold of statistical significance, you should expect around one in twenty to look significant purely by chance, which here means well over a hundred false winners. The Pune commuters may be real. But nothing about the way they were found tells us so. The team painted the target around the tightest cluster of holes, then wrote a story about why they had aimed there.
The honest version doesn't throw the finding away. It changes its status. The slide says: "We looked at more than three thousand segments. One of the strongest was this one. It's a hypothesis, not a result." The team writes the hypothesis down and checks it on new data, the next month's sign-ups, which played no part in finding it. If the effect holds up, they can start to believe the commuter story. If it fades, as most of these do, they've lost a week instead of a marketing budget. Statisticians have well-known corrections for multiple comparisons, but the simplest is to be much harder to impress when you've looked in many places.
When a cluster is real
Exploring data without a hypothesis isn't the problem. The statistician John Tukey argued for exactly that in his 1977 book Exploratory Data Analysis. It's how new ideas are born. The fallacy only begins when a pattern found by exploring is reported as if it had been predicted, or treated as confirmed without being tested on data that played no part in finding it.
And sometimes the cluster really does mean something. In 1775, the London surgeon Percivall Pott noticed that cancer of the scrotum, otherwise rare, was common among men who had worked as chimney sweeps from childhood, and linked it to soot. In 1974, doctors in Louisville, Kentucky reported that three workers at a single chemical plant had developed angiosarcoma of the liver, a cancer so rare that even a few cases in one workplace was extraordinary, and the cause was traced to vinyl chloride, a chemical used to make PVC.
What these real clusters share is useful. The disease was unusual and specific, not a loose grouping of many different illnesses. The people affected shared a specific, plausible exposure, with a mechanism that could be investigated. And the finding held up when others went looking in new places, among other sweeps and other plastics workers. Those are the same checks I'd use on a dashboard. Is the pattern specific? Was it predicted, or found? Does it survive fresh data?
How I try to catch it
The first question I ask is: how many places did we look? A finding from the only thing we tested means something very different from the best of three thousand slices. If nobody knows the number, I assume it's large.
The second is: did we draw the target before or after? When I'm planning research or an experiment, I try to write down the specific thing I expect to see, even roughly, so that I can tell afterwards whether I've found it or merely found something.
The third is: would it hold in data we haven't seen? A pattern I found becomes a question for the next batch of data, not an answer to put on a slide. Waiting is uncomfortable when a review is coming, but less so than building a strategy on a cluster of holes.
Drosnin's codes were impressive in exactly the way the barn wall is impressive: every hit lands in the centre once you choose where the centre is. McKay didn't have to argue with any particular prediction. He only had to show that the same method would find Indira Gandhi in a novel about a whale. In the next post, on the appeal to novelty, I'll look at a different temptation, the belief that something must be better simply because it's new.
Further reading: Atul Gawande, "The Cancer-Cluster Myth" (1999) · Brendan McKay, Dror Bar-Natan, Maya Bar-Hillel and Gil Kalai, "Solving the Bible Code Puzzle" (1999) · Joseph Simmons, Leif Nelson and Uri Simonsohn, "False-Positive Psychology" (2011) · Andrew Gelman and Eric Loken, "The Garden of Forking Paths" (2013) · Norbert Kerr, "HARKing: Hypothesizing After the Results Are Known" (1998)
The question to askDid we draw the target before or after we fired?