Hasty Generalisation
How a few cases, or the wrong ones, turn into a confident rule about everyone.
Hasty Generalisation
Two million ballots and the wrong president
In 1936, The Literary Digest was one of the most widely read magazines in the United States, and it had a famous party trick. It ran a straw poll before each presidential election, and it had correctly picked the winner every time since 1916. That autumn it outdid itself. It mailed around ten million mock ballots to people drawn from lists such as telephone directories, car registrations and its own subscribers. About 2.4 million came back, an enormous number for any survey, then or now. The verdict was clear. Alf Landon, the Republican governor of Kansas, would beat President Franklin Roosevelt comfortably, by roughly fifty-seven per cent to forty-three.
Roosevelt won one of the biggest landslides in American history. He took about sixty-one per cent of the vote and every state except Maine and Vermont. Meanwhile a young pollster named George Gallup, working with a sample of around fifty thousand people, called the result correctly. He had even published, in advance, a forecast of roughly what the Digest's own poll would show. Within two years, the Digest had been absorbed by Time.
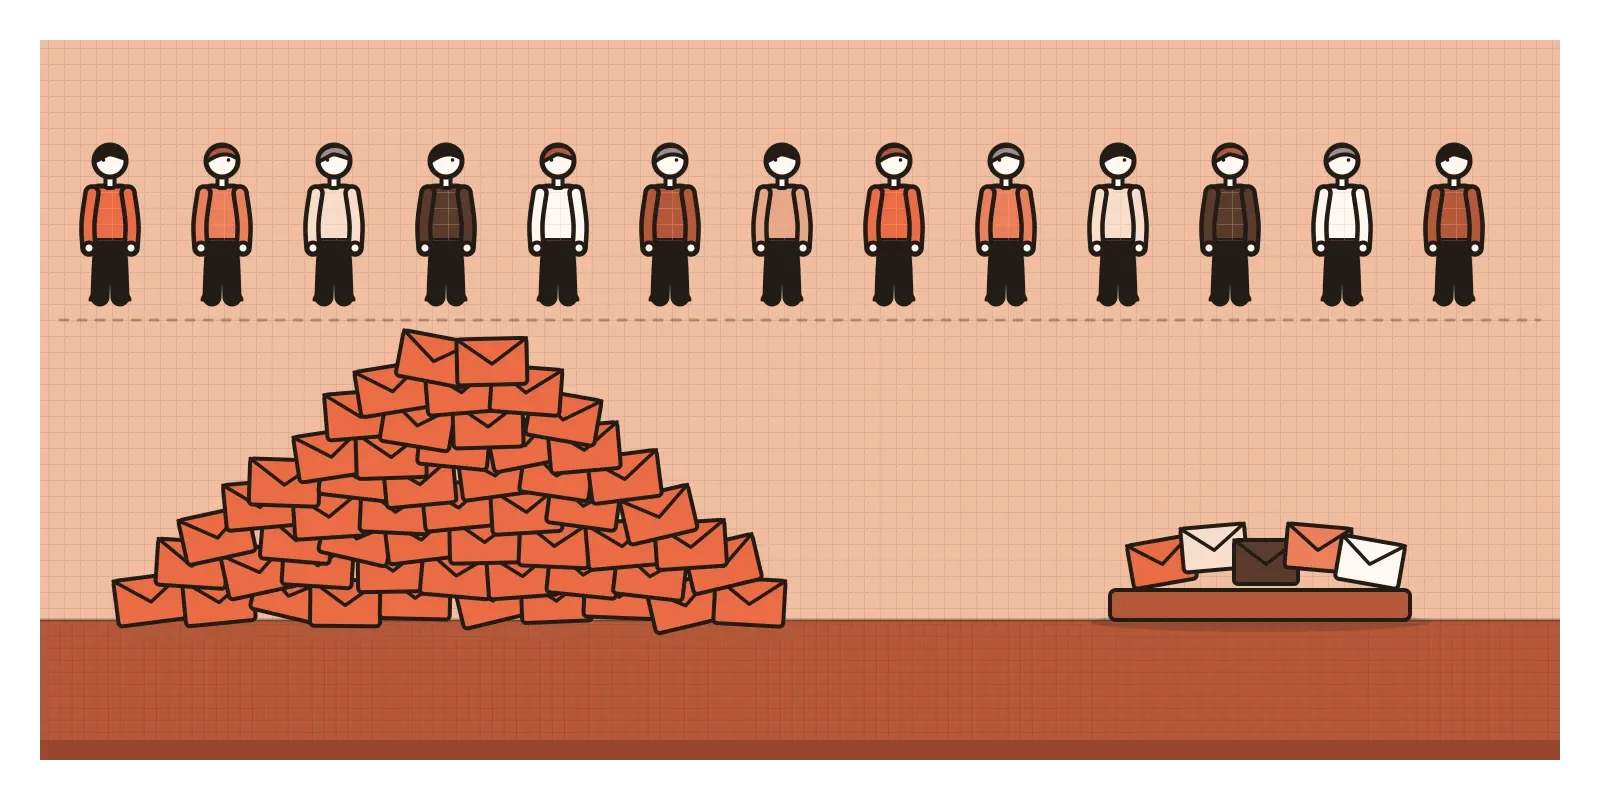
For years, the standard explanation was that in the middle of the Great Depression, people who owned telephones and cars were wealthier than average, and wealthier voters leaned towards Landon. Later work, notably an analysis by the political scientist Peverill Squire published in 1988, suggested that a bigger problem was who chose to reply. Landon's supporters were more motivated to send their ballots back. Either way, the lesson is the same. Two million answers from the wrong people told the Digest less than fifty thousand from the right ones.
That's hasty generalisation: drawing a broad conclusion from a sample that is too small, or too unrepresentative, to support it. It's also called the fallacy of insufficient sample, or simply overgeneralising, and some logic textbooks link it to an old Latin label, secundum quid, for a claim stretched beyond the conditions in which it holds. When the sample shrinks all the way to a single vivid story, it becomes anecdotal evidence, which I'll come to in a later post. Here I'm interested in the handful, and in the crowd that only looks like everyone.
From a few white swans to all swans
Philosophers have worried about this leap for a long time. In Novum Organum, published in 1620, Francis Bacon criticised what he called induction by simple enumeration, collecting cases that agree with a conclusion without looking for ones that might contradict it. He thought it childish, because a single contrary example could overturn the whole thing.
The classic illustration is the swan. For centuries, Europeans used "a black swan" as a figure of speech for something that couldn't exist, because every swan anyone had seen was white. Then, in 1697, the Dutch explorer Willem de Vlamingh and his crew saw black swans on a river in Western Australia. Every observation had been true. They had simply all come from one part of the world.
John Stuart Mill, in his System of Logic of 1843, asked the most useful question about all this. Why is it, he wondered, that a single experiment is sometimes enough to establish a general rule, while in other cases thousands of agreeing examples prove almost nothing? His answer, in modern terms, is that it depends on how much the things you're studying vary. If you know the cases are alike, a few will do. If they differ in ways you haven't measured, you need many, chosen carefully. Hasty generalisation is what happens when we forget to ask how varied the world is before deciding how much to look at.
The law of small numbers
In 1971, Amos Tversky and Daniel Kahneman published a short paper with a mischievous title, "Belief in the law of small numbers". The real law of large numbers says that big samples tend to resemble the population they're drawn from. Tversky and Kahneman showed that people, including trained research psychologists whom they surveyed at professional meetings, behave as if the same were true of small samples. They expected a small study to closely mirror reality, and they were far too confident that its results would repeat.
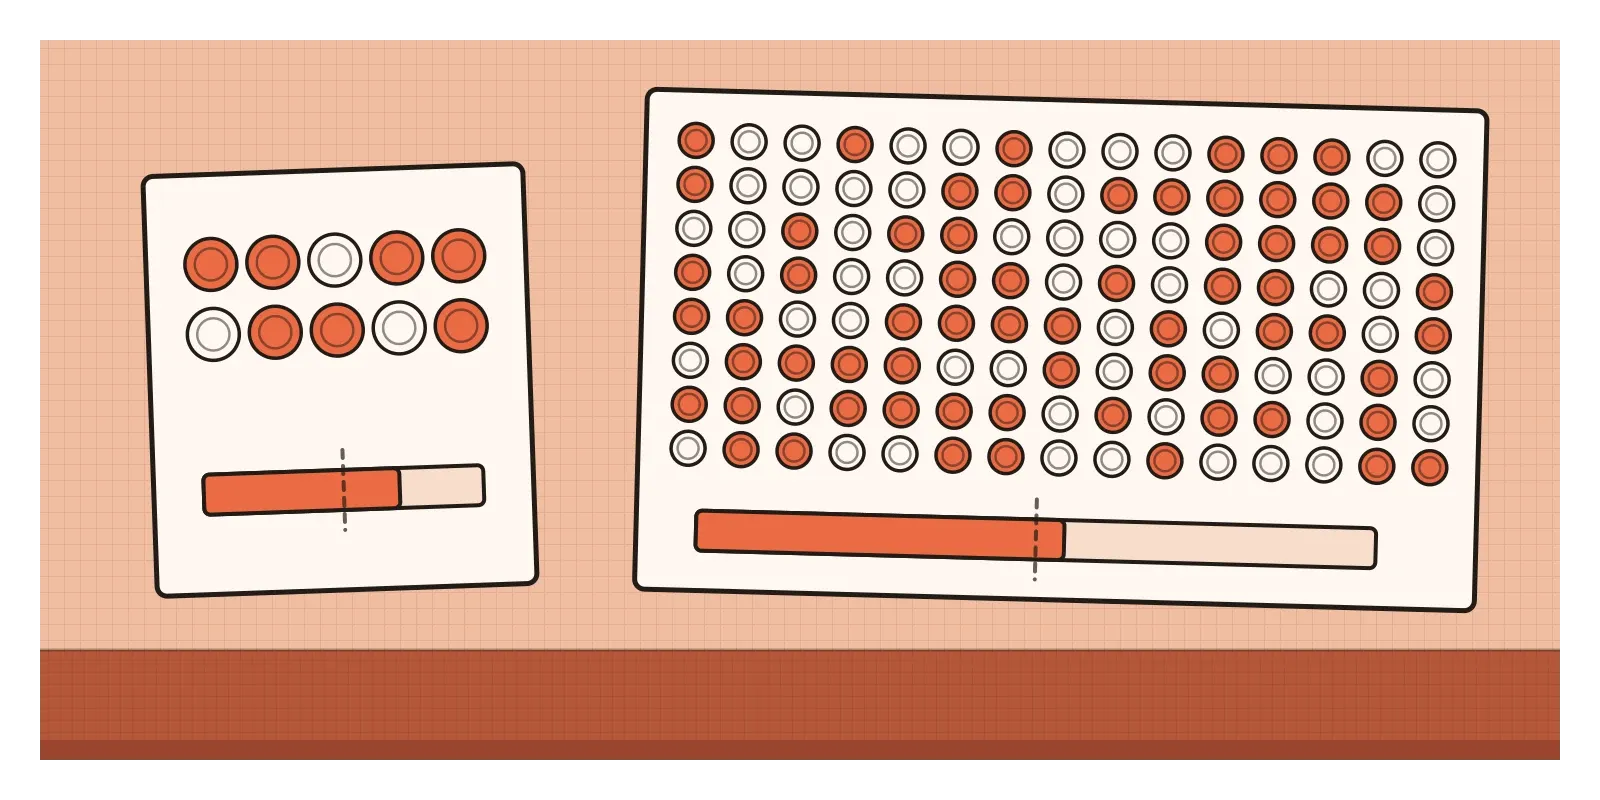
The mathematics is unforgiving. Toss a fair coin ten times, and you'll get seven or more heads about one time in six. Toss it a thousand times, and getting seven hundred heads is so unlikely that you could toss coins all your life and never see it. Small samples swing wildly. Our intuition, though, treats every sample as a little portrait of the whole, so a striking result from a handful of cases feels like a discovery rather than a fluke.
The second reason we fall for it is convenience. We generalise from whoever is easiest to reach: the people around us, the customers who reply to emails, the users who turn up to interviews. A sample of the easy-to-reach can be very large and still deeply lopsided, as the Digest found out.
This affects science itself. In 2010, the psychologists Joseph Henrich, Steven Heine and Ara Norenzayan published a paper called "The weirdest people in the world?". They pointed out that most published psychology studies drew their participants from Western, educated, industrialised, rich and democratic societies, and very often from university students, and that on many measures these people turned out to be unusual compared with the rest of humanity. Findings about "human" perception, fairness or reasoning were often findings about a narrow slice of humans. A related analysis by Jeffrey Arnett in 2008 found that about ninety-six per cent of participants in studies in leading psychology journals came from countries that are home to around twelve per cent of the world's population. For anyone designing products used in India, that's a sobering thing to remember when a well-known study is quoted at us.
The small schools that were also the worst schools
In the late 1990s and 2000s, American education reformers noticed something encouraging. When they looked at the schools with the highest test scores, small schools were over-represented among them. The Bill and Melinda Gates Foundation, among others, invested heavily in breaking up large schools into smaller ones, reportedly committing more than a billion dollars to the effort.
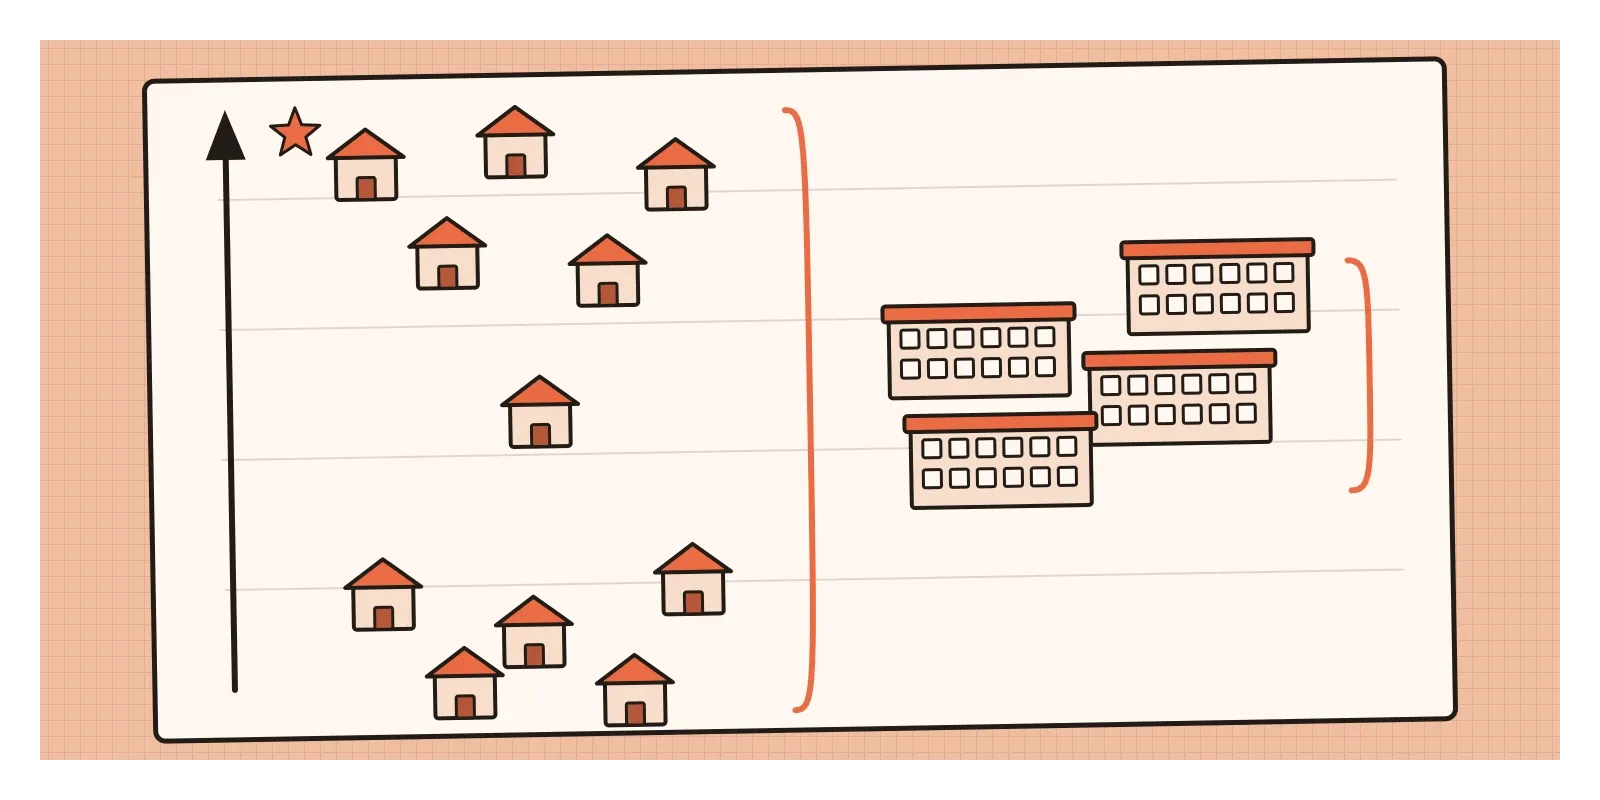
In a 2007 article for American Scientist called "The Most Dangerous Equation", the statistician Howard Wainer explained what had been missed. If you looked at the schools with the lowest scores, small schools were over-represented there too. Small schools weren't better. They were more variable. With fewer students, a few unusually strong or weak pupils move the average a long way, so small schools pile up at both ends of any ranking. Wainer's dangerous equation, first worked out by the mathematician Abraham de Moivre in the eighteenth century, says that the variation in an average shrinks as the sample grows. Ignore it, and noise looks like a pattern. The foundation later changed course, and in his 2009 annual letter Bill Gates acknowledged that many of the small schools it had funded hadn't improved students' achievement in any significant way.
India saw a different version in June 2024. On the evening voting ended in the general election, most major exit polls predicted a sweeping majority for the ruling National Democratic Alliance, with several projecting more than 350 of the 543 seats. When the votes were counted, the alliance won 293, and the BJP on its own fell short of a majority. The biggest misses came in states such as Uttar Pradesh. There were several reasons for the errors, but a common thread in the post-mortems was samples that didn't capture how some groups and regions had actually voted. Large national samples can still be built from too few of the places where the story is changing.
Eight interviews and a percentage
Picture a team at a payments company exploring an AI feature that automatically sorts your spending into categories. To test the idea, they recruit eight people for interviews. To move quickly, they find them through the company's own community group and a few friends of the team. All eight live in Bengaluru, all are in their twenties or early thirties, all use the app in English on fairly new phones, and most work in technology.
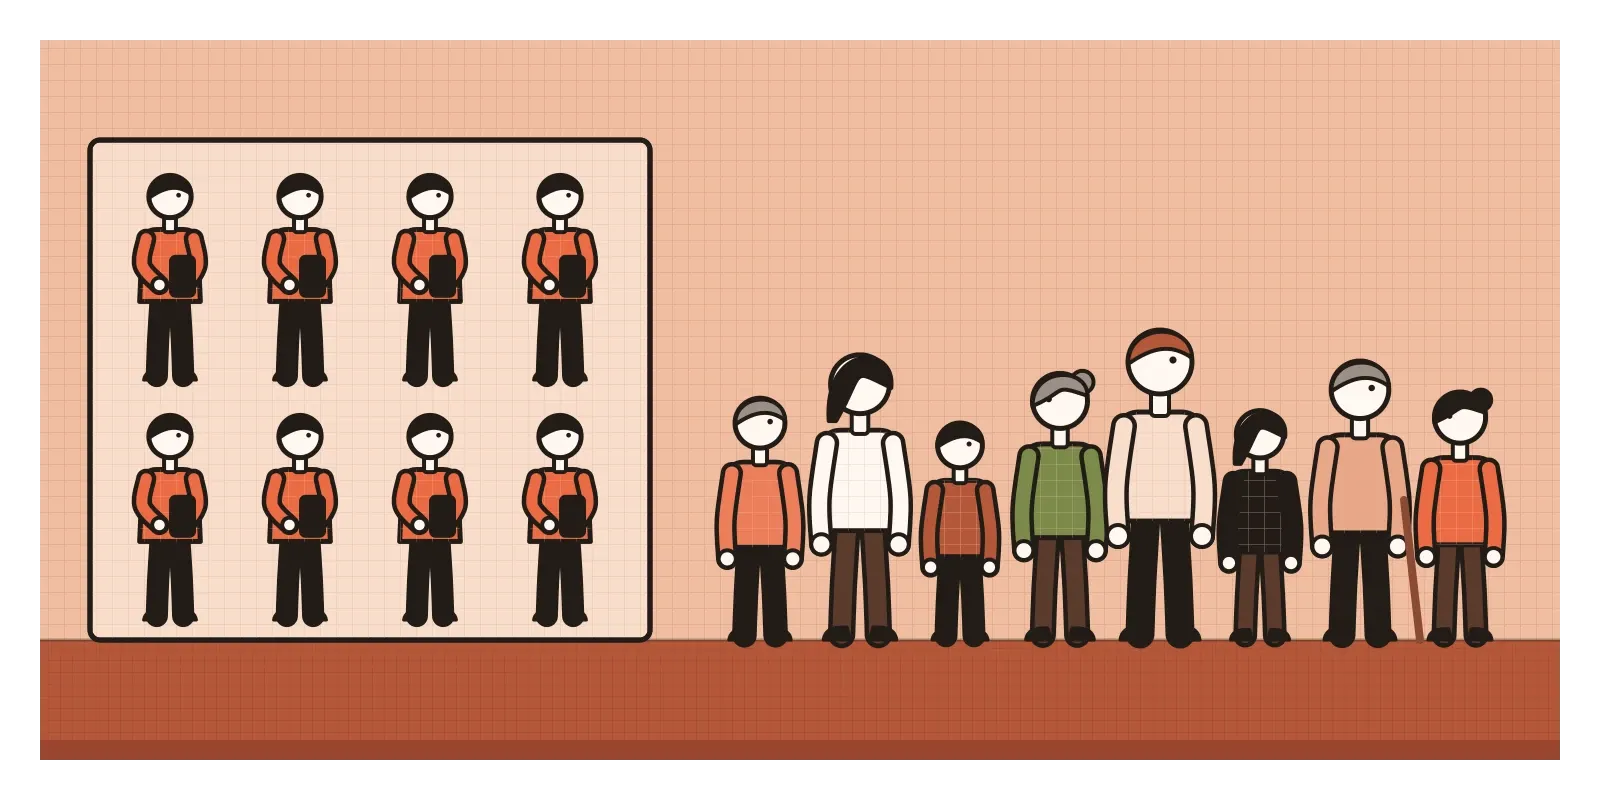
Six of the eight say they'd love the feature. In the synthesis deck, this becomes "75% of users want AI categorisation", in large type. A month later, it appears in a pitch to leadership as strong user demand.
Walk back through it. The percentage is six people, which means a single different answer would move it by more than twelve points. More importantly, the six weren't drawn from the app's users. The company's users are spread across hundreds of towns, many of them use the app in Hindi, Tamil or Bengali, and a large share are older and less comfortable with automation touching their money. The interviewees were the people easiest for the team to reach, which is to say the people most like the team.
The honest version of the slide reads: "Six of eight early adopters in Bengaluru were enthusiastic. We don't yet know how the wider user base feels." It would add what they learned that doesn't depend on the numbers, the specific worries and hopes people described, and propose a next step that can measure demand properly, such as recruiting across cities and languages, or a small in-product test with a randomly chosen group of users.
When a few cases are enough
Small samples aren't always a problem. They depend on the question. In 2000, Jakob Nielsen wrote a widely shared article arguing that you only need to test with five users, based on earlier work with Thomas Landauer. Its point is often misunderstood. Five users are enough to find most of the serious usability problems in a design, because a problem that trips up a third of people will very likely show up at least once among five. They're nowhere near enough to say what percentage of users will have the problem, or to compare two designs. Nielsen himself recommended testing several small rounds and separate groups for different kinds of users. Finding problems and measuring them are different jobs, and small samples are good at the first.
A single case can also be decisive in the other direction. De Vlamingh only needed a few black swans to overturn the claim that all swans are white. Generalising from a few cases is hasty. Refuting a generalisation with a few cases is often perfectly sound.
And as Mill noticed, sometimes the world is uniform enough that a little evidence goes a long way. A designer doesn't need to test a contrast ratio on a thousand people, because the physics of light and the biology of the eye don't vary much between them. The question is always how much the cases differ in ways that matter to the claim.
How I try to catch it
The first habit is the simplest. Whenever I write a number in a research summary, I write how many people it came from beside it. A percentage without its base hides how fragile it is. "Six of eight" and "75%" are the same fact, but only one of them tells the truth about its strength.
The second is to ask how the sample was found, and who could never have ended up in it. Who didn't reply to the email? Who doesn't use the app in English? Who wasn't online at the time of the survey? The answer usually tells me more than the results do.
The third is to sort every finding into one of two piles: things we discovered, and things we measured. Discoveries, like a confusing label or an unexpected use, can come from a handful of people. Claims about how common something is need a sample built for that purpose.
The Literary Digest didn't fail because it was lazy. It worked harder than anyone and collected more answers than anyone. It failed because it never asked who wasn't in the pile. Two million answers from the wrong people are still the wrong people. In the next post, on the straw man, I'll look at a fallacy that misrepresents not a population but an opponent.
Further reading: Amos Tversky and Daniel Kahneman, "Belief in the law of small numbers" (1971) · Howard Wainer, "The Most Dangerous Equation" (2007) · Joseph Henrich, Steven Heine and Ara Norenzayan, "The weirdest people in the world?" (2010) · Peverill Squire, "Why the 1936 Literary Digest poll failed" (1988) · Jakob Nielsen, "Why You Only Need to Test with 5 Users" (2000)
The question to askHow many, and who did we leave out?